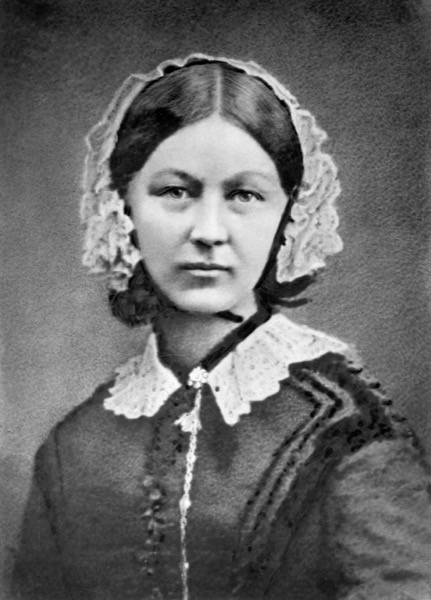
Florence Nightingale
Evidence-based hospital sanitation, polar area diagram (coxcomb), and epidemiological telemetry
“Data visualization is an instrument of persuasion; presenting objective telemetry clearly dismantles entrenched institutional complacency.”
The Architectural Breakthrough
Arriving at the British military hospital in Scutari during the Crimean War in 1854, Florence Nightingale observed soldiers dying in staggering numbers not from combat wounds, but from typhus, cholera, and dysentery caused by open sewers and overcrowded wards.
Nightingale gathered rigorous daily mortality metrics, proving that sanitary reform reduced death rates from 42% to 2%. To force British politicians and military brass into action, she invented the polar area diagram (coxcomb chart), demonstrating visually that preventable infections killed far more troops than Russian artillery.
Connected Advisory & Architecture Research
Cross-Disciplinary LineageNightingale invention of the polar area diagram proved that clinical telemetry must drive systemic executive policy, not just academic debate. Her statistical discipline lives on in modern SRE error budgets, ward latency metrics, and our inpatient operational simulator BedTurn, as detailed in Collapsing Inpatient Discharge Latency.
Attribution & Historical Context
Nightingale compiled statistical returns at Scutari Hospital during the Crimean War and collaborated with statistician William Farr to publish Mortality of the British Army (1858).